
How to Measure Experiential Marketing ROI
The activation worked. You watched the line form on its own. Your CEO stopped by twice and brought someone with her the second time. Attendees were still posting about it Sunday night.
Then Monday arrived, finance asked what it returned, and the honest answer was a folder of photographs and a strong feeling.
That gap is the single biggest reason experiential budgets get cut before they get scaled. Not because the work underperformed. Because nobody built the measurement structure before the doors opened, and a result that cannot be stated in numbers gets remembered as an expense.
Experiential is not harder to measure than paid media. It is measured differently, across four layers instead of one. Get the structure right and you walk into your next budget conversation with evidence instead of adjectives.
This is the full framework: the four layers, the formulas, benchmarks labeled honestly as verified or estimated, the role a photo activation plays in instrumenting all of it, and a calculator you can run against your own event.
Why most brand activations get measured wrong
Three failures account for nearly every unmeasurable activation. They are all preventable and none of them are about the creative.
Failure one: forcing a live event into a digital attribution model
Marketing operations teams are built around last-touch and multi-touch models that assume a trackable click. A live room produces no click. When an activation gets pushed through that model, most of its value falls outside the system and the number that comes back looks embarrassing next to a paid search line item.
The activation did not underperform. The measurement instrument was wrong for the channel. A live experience produces value in a sequence, and it has to be tracked in that same sequence, layer by layer, with each layer carrying its own cost figure.
Failure two: counting everything and proving nothing
The opposite error is the post-event report with impressions, footfall, sentiment quotes, a screenshot of a good comment, and eleven photographs. It reads well and convinces no one, because a finance team cannot compare it to anything.
Volume of data is not evidence. A single defensible cost per captured lead, benchmarked against your other acquisition channels, will do more for next year’s budget than forty slides of activity.
Failure three: deciding what success means after the event
This is the expensive one. Almost every metric worth reporting depends on a decision made before the event. The CRM source tag. The qualifying field in the capture flow. The verified attendance figure from the organizer. The control group for brand lift.
None of those can be reconstructed on Monday morning. If they were not built in, the activation is permanently unmeasurable and no amount of analysis will fix it.
The four-layer experiential marketing ROI model
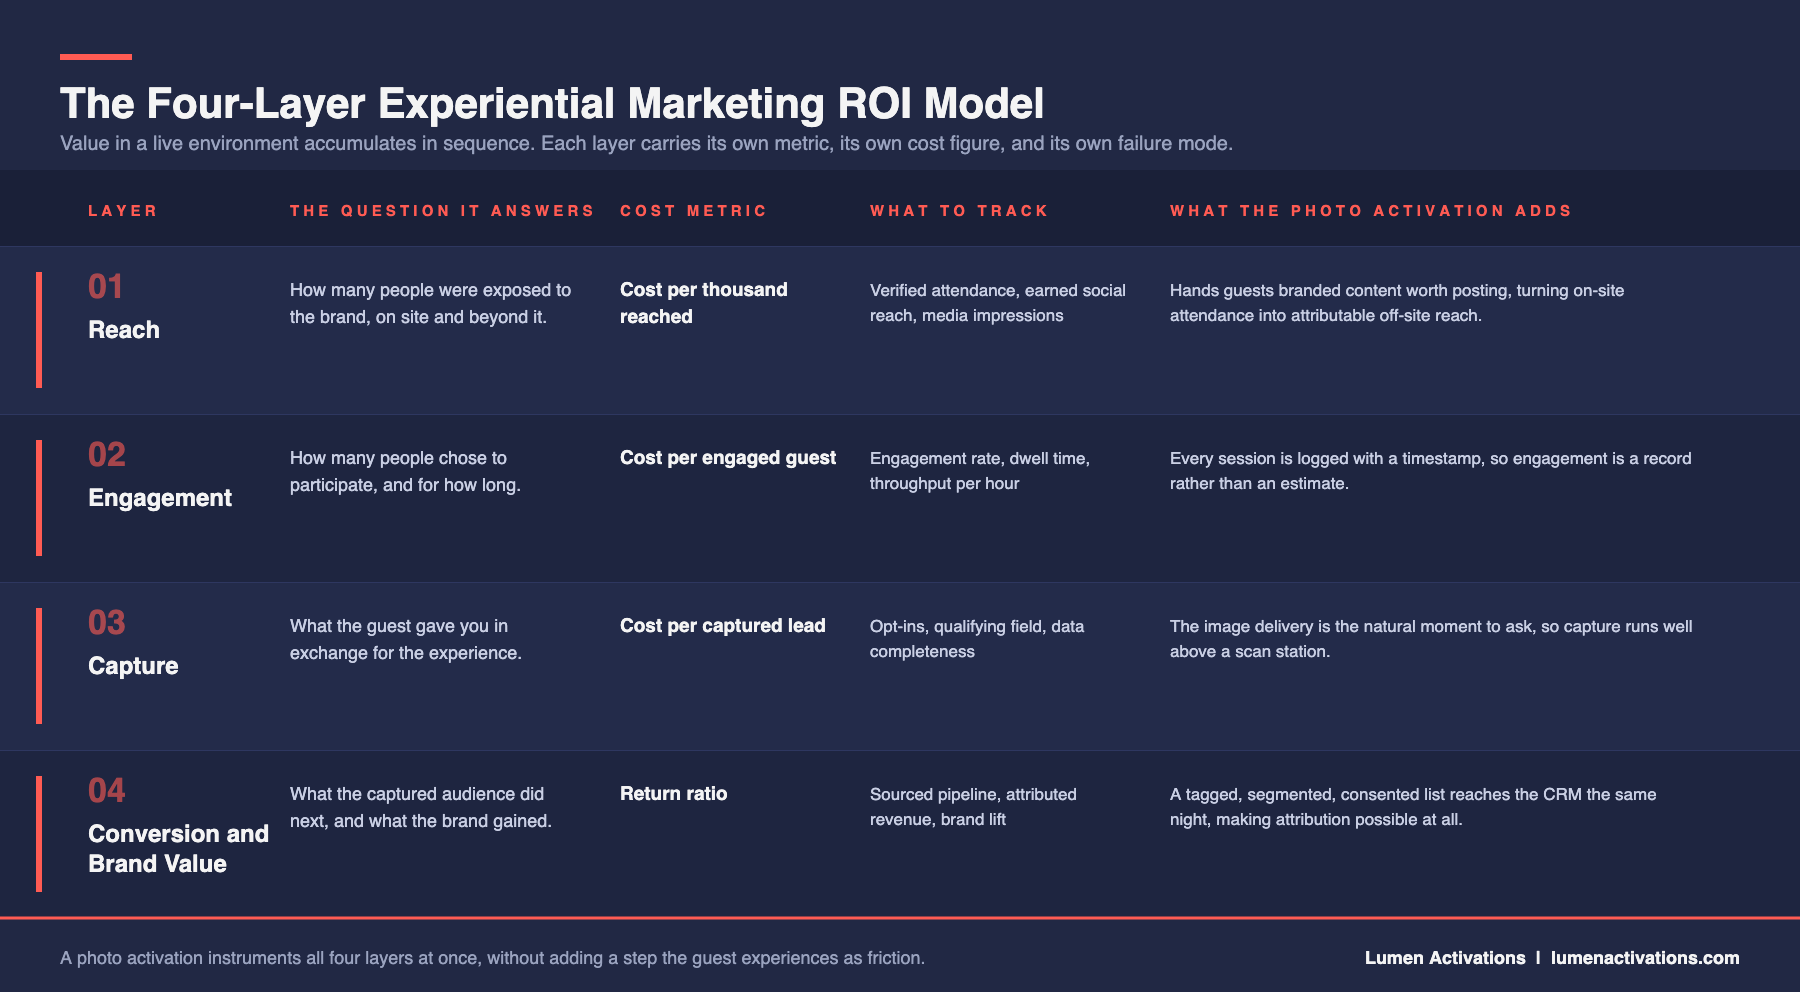
Value in a live environment accumulates in sequence. A guest is reached, then engages, then gives you something, then does something. Each stage is a separate layer with its own metric, its own cost figure, and its own failure mode.
Measured separately, the story holds up under scrutiny. Collapsed into one number, it does not.
Layer 1: Reach
The question it answers: how many people were exposed to the brand, on site and beyond it.
What to track: verified event attendance, activation impressions, earned social reach from guest-shared content, media pickup, and any owned channel amplification you drove afterward.
How to capture it: pull verified attendance from the event organizer rather than registration counts. The two numbers diverge by twenty to forty percent at most conferences, and using the registration figure quietly deflates every rate you calculate afterward. Track a branded hashtag and a unique share domain on every digital delivery so guest sharing is attributable rather than assumed.
The formulas:
Total reach = on-site attendance + earned social reach + media impressions
Cost per thousand reached = (total investment / total reach) x 1,000
What good looks like: a cost per thousand competitive with your paid social benchmark. If your activation reaches at a lower CPM than your paid channels, you have a defensible point before you have discussed a single lead.
The failure mode: stopping here. Reach alone proves nothing. It is the denominator every other layer gets judged against.
Layer 2: Engagement
The question it answers: how many people chose to participate, and for how long.
What to track: completed experiences, engagement rate as a percentage of verified attendance, average dwell time, throughput per hour, queue abandonment, and repeat participation.
How to capture it: your activation platform should log every session with a timestamp. That log is the raw material for the entire layer and you should expect it delivered, not request it.
Throughput matters as much as volume. An experience that engages 400 guests over three hours with no queue abandonment is a materially stronger result than one that engages 400 over eight hours while people walk away. The first tells you the concept has pull and the operation can handle it. The second tells you the operation is losing you guests.
Dwell time is the quality signal inside the engagement number. Ninety seconds of active participation is a brand impression. Eight seconds is a walk-by that happened to trigger a sensor.
The formulas:
Engagement rate = completed experiences / verified attendance
Cost per engaged guest = total investment / completed experiences
Throughput = completed experiences / active hours
What good looks like: twenty-five to forty percent of verified attendance for a well-placed activation, with throughput steady across the peak window rather than front-loaded.
The failure mode: treating a low engagement rate as a creative problem when it is almost always a placement problem. An activation positioned outside the primary traffic flow will underperform a weaker concept placed correctly, every time. Before you rebuild the concept, look at the floor plan.
Layer 3: Capture
The question it answers: what the guest gave you in exchange for the experience.
What to track: email and mobile opt-ins, qualifying survey responses, badge scans, capture rate as a percentage of engaged guests, and data completeness across fields.
How to capture it: build the data ask into the delivery moment, not the entry moment. This single sequencing decision moves capture rates more than any other variable in the flow. A guest who has just seen their own image and wants it will enter an email address without hesitation. The same guest standing in a queue, asked for contact details before receiving anything, converts at a fraction of that rate.
Ask for exactly one qualifying field beyond contact details. Role, buying timeline, product interest, or company size, depending on what your sales team actually filters on. That one field turns a list into a segment, and a segment is what lets Layer 4 exist at all. Two additional fields will cost you capture rate. Three will cost you a great deal of it.
Set an explicit consent standard at the point of capture. A list you cannot legally email is not a captured lead, it is a liability with a cost attached.
The formulas:
Capture rate = opt-ins / engaged guests
Cost per captured lead = total investment / opt-ins
Qualified capture rate = opt-ins meeting your criteria / opt-ins
Why this layer matters most: cost per captured lead is the number that lets you compare an activation directly against paid search, a sponsored webinar, a syndication buy, or a list purchase. It is the first fully apples-to-apples figure in the model, and it is usually the moment the conversation with finance changes character.
The failure mode: capturing volume with no qualifying field. Two thousand unsegmented email addresses will sit in a marketing automation platform untouched, and next year the activation gets remembered as the one that generated a list nobody used.
Layer 4: Conversion and brand value
The question it answers: what the captured audience did next, and what the brand gained that will never appear in a CRM.
What to track: qualified opportunities sourced, influenced pipeline, closed revenue attributed to activation leads, sales cycle length against your baseline, and brand lift measured through a short post-event survey against a control group.
How to capture the revenue side: tag every activation lead with a dedicated source value in your CRM before the event, not after. Set a realistic attribution window based on your actual sales cycle, typically ninety days for a considered B2B purchase. Decide in advance whether you are reporting sourced or influenced pipeline and never move between the two mid-analysis. Sourced is stricter and more defensible. Influenced is larger and invites challenge.
One underused metric: compare the sales cycle length of activation-sourced leads against your baseline. Leads that met your team in person frequently close faster, and a shortened cycle carries real financial value most reports never claim.
How to capture the brand side: a four-question pulse survey sent to attendees and to a matched list of non-attendees gives you a defensible lift figure without the cost of a formal brand study. Ask about aided awareness, consideration, one attribute you are actively trying to own, and likelihood to recommend. The delta between the two groups is your lift.
The formulas:
Qualified opportunities = opt-ins x qualification rate
Influenced pipeline = qualified opportunities x average deal value
Attributed revenue = influenced pipeline x close rate
Return ratio = total value created / total activation investment
The reporting rule: report brand lift alongside revenue, never blended into it. Combining a soft estimate with a hard revenue figure into one number is precisely what makes a finance team distrust the entire report. Two clean numbers beat one impressive one.
Why a photo activation is the most measurable element on the floor
Here is the practical problem with the model above. Most of what happens at a live event leaves no record. A conversation at a booth, a demo, a keynote, a branded lounge. All of it generates value and none of it generates data unless someone stops to write it down.
A photo activation is different, and it is worth understanding why before you decide where to spend. It is one of the only elements on an event floor that instruments all four layers at once, without adding a single step the guest experiences as friction.
It makes Layer 2 automatic
Every session is logged with a timestamp. That means engagement rate, dwell time, throughput per hour, and repeat participation are not estimates or clicker counts. They are records, available the same night, in a format you can put directly into a report.
No other element in the room gives you that. A sponsored lounge cannot tell you how many people used it. A photo activation can tell you how many, when, and for how long, hour by hour.
It makes Layer 3 voluntary
Data capture usually asks a guest to give something and receive nothing. A photo activation inverts that. The guest wants the image, and the delivery of that image is the natural moment to ask for an address and one qualifying field.
That is why capture rates in this format run so much higher than at a scan station or a fishbowl. The exchange feels fair to the guest, because it is. And because the ask lands at delivery rather than entry, you are asking someone who has already had a good experience rather than someone deciding whether to have one.
It makes Layer 1 compound
Nearly every attendee creates digital content at events. A photo activation is the only format that hands them branded content worth posting, already framed, already tagged, ready to share before they leave the room.
That converts your on-site attendance into off-site reach, and a unique share domain makes it attributable rather than assumed. The activation stops being a fixed-audience line item and starts functioning as a distribution channel with a measurable multiplier.
It gives Layer 4 something to work with
A tagged, segmented, consented list flowing into your CRM the night of the event is what makes revenue attribution possible at all. Without it, Layer 4 is a hypothesis. With it, your sales team has named people, sorted by the criteria they actually filter on, while the event is still fresh enough to reference in a first call.
The strategic point is this. Choosing a photo activation is not only a creative decision about what guests will enjoy. It is a decision about whether your event will be measurable, and that is a decision better made in the brief than in the recap.
A worked example
A regional industry conference. 1,200 verified attendees. A photo activation with an $18,000 total investment covering the experience fee, staffing, creative development, printing, and travel.
The activation completed 420 experiences, an engagement rate of thirty-five percent, pulled straight from the session log. Cost per engaged guest lands at $43.
Of those 420, 290 opted in at delivery with a role field attached, a capture rate of sixty-nine percent. Cost per captured lead lands at $62. That figure alone is the one worth carrying into the budget meeting, because it is directly comparable to every other channel on the marketing plan.
Sales qualifies twelve percent of those leads, producing 35 opportunities. At an average deal value of $9,500 that is roughly $330,000 in influenced pipeline. At a twenty-two percent close rate the attributed revenue is approximately $73,000. Add a conservative $6,000 in earned media and reusable content value and the return ratio sits near 4.4 to 1.
Notice what carried the argument. Not the $73,000, which depends on a close rate finance can dispute. The $62 cost per captured lead, which is measured, not modeled.
Benchmarks worth measuring against
Two labels appear below. Verified means the figure traces to the organization that produced it. Estimated means it is directional, drawn from aggregated industry reporting or from Lumen Activations project data, and should be pressure tested against your own results before it goes into a deck.
| Benchmark | Figure | Status | Source |
|---|---|---|---|
| Global experiential marketing spend, 2024 | $128.35 billion | Verified | PQ Media forecast |
| Consumer marketers increasing event spend in 2026 | 84% | Verified | EventTrack 2026 |
| B2B marketers increasing event spend in 2026 | 86% | Verified | EventTrack 2026 |
| Consumers more inclined to purchase after a live event | 61% | Verified | EventTrack 2026 |
| B2B attendees who feel more educated after an event | 85% | Verified | EventTrack 2026 |
| Attendees who create digital or social content at events | 98% | Verified | EventTrack 2026 |
| Typical return on experiential spend | 3:1 to 5:1 | Estimated | Widely repeated industry range, no single primary study |
| Marketers who feel confident tracking experiential ROI | Roughly 23% | Estimated | Aggregated secondary reporting |
| Engagement rate for a well-placed photo activation | 25% to 40% of verified attendance | Estimated | Lumen Activations project data |
| Capture rate among engaged guests, ask placed at delivery | 60% to 80% | Estimated | Lumen Activations project data |
| Cost per captured lead, mid-size corporate activation | $40 to $95 | Estimated | Lumen Activations project data |
| Gap between registered and verified attendance | 20% to 40% | Estimated | Lumen Activations project data |
The verified rows make the case that the channel is growing and that audiences respond to it. They are context, not proof of your activation. The estimated rows are for calibration. If your engagement rate came in at eight percent against a twenty-five to forty percent range, you have a placement or promotion problem worth diagnosing before you spend again.
The most useful line is the one about confidence. Roughly three quarters of marketers running this channel cannot defend its return with data. Being in the other quarter is a competitive position inside your own organization, not an administrative chore.
Run your own numbers
The calculator below applies the four-layer model to a single activation. Enter your investment and engagement figures and it returns engagement rate, capture rate, cost per engaged guest, cost per captured lead, influenced pipeline, attributed revenue, and a return ratio you can carry into a budget meeting.
If the return ratio comes back below 2 to 1, resist the instinct to blame the concept. Check placement and throughput first, then check whether your cost base included items the activation did not actually consume.
Weight the model to the event type
Not every activation needs all four layers carrying equal weight. Deciding which layer is primary before the event keeps the measurement focused enough to be persuasive.
Trade show floor. Layers 3 and 4 carry the weight. The audience is pre-qualified and the objective is pipeline. The qualifying field is mandatory and the report should lead with qualified opportunities rather than total scans.
Industry conference or leadership summit. Layers 2 and 3. The room is smaller and higher value, and the win is meaningful participation from the right people. Engagement rate against verified attendance is your headline.
Consumer facing festival or public activation. Layers 1 and 2. Reach and participation are the product, and the share behavior a photo activation generates is doing most of the work.
Internal employee or culture event. Layers 2 and 4, with brand lift replaced by an internal sentiment measure. Participation rate and post-event survey delta are the whole story.
Nonprofit gala or donor event. Layers 2 and 4. Engagement drives the room, and the conversion metric is donor action rather than pipeline. Attribution windows run longer, often to the next giving cycle.
The pre-event measurement checklist
Every item below has to be settled before the event. Each takes minutes in advance and cannot be recovered afterward.
- Name the primary layer for this event and write it down.
- Confirm how you will obtain verified attendance and from whom.
- Create the CRM source value and confirm it is live in the form the leads will flow into.
- Choose the single qualifying field and confirm your sales team actually filters on it.
- Confirm the data ask sits at delivery, not entry.
- Set the consent language and confirm it meets your legal standard.
- Set the attribution window and the definition of sourced versus influenced.
- Build the four-question brand lift survey and the matched control list.
- Agree with your experiential partner what the session log will contain and when it arrives.
- Set the full investment figure, including soft costs, so the denominator is honest.
Report on a timeline, not at the end
Within five business days: report Layers 1 through 3. Reach, engagement, capture, and the two cost figures. The event is still live internally and this is when the numbers land hardest.
At thirty days: report early pipeline movement and brand lift survey results. This keeps the activation present in the conversation while opportunities mature.
At ninety days, or when your window closes: report the full Layer 4 result and the final return ratio. File it where next year’s planning cycle will find it.
Waiting until ninety days to report anything means the activation gets measured after the budget conversation has already happened. That is the most common way a successful activation loses its funding.
What to do when the numbers come back weak
A weak result is diagnostic, not final, and the four-layer structure tells you exactly where to look.
Low reach with strong engagement means the activation worked but too few people saw it. Fix placement and pre-event promotion.
Strong reach with low engagement means the concept did not earn opt-in. Look at visibility, the first three seconds of the invitation, and whether staffing was actively inviting participation or standing behind equipment.
Strong engagement with low capture means the ask was placed wrong or asked too much. Move it to delivery and cut fields.
Strong capture with weak conversion means the qualifying criteria were too loose or sales never worked the list. That is not an activation failure, and reporting it as one costs you a channel that was actually performing.
Build the measurement into the activation, not after it
Every metric in this framework depends on a decision made before the event. Which means measurement is not a reporting function. It is a design function, and it belongs in the brief alongside the creative.
Lumen Activations builds the measurement plan into the activation design. The session log, engagement data, and capture reporting arrive as a deliverable rather than a favor. We have run this for corporate leadership summits, nonprofit galas, and trade show floors across Kansas City and beyond, for teams that had to justify the line item internally before they could sign anything.
If you have an event on the calendar that will need to defend its own budget next year, put twenty minutes on the calendar and we will map the measurement structure for it.
Frequently asked questions
What is a good ROI for experiential marketing?
The commonly cited range is 3:1 to 5:1, though that figure is directional rather than the product of a single controlled study, and it should be labeled that way when you use it. A more useful internal standard is your own cost per captured lead compared against your other acquisition channels. If an activation delivers qualified leads at or below the cost of paid search, it is performing, regardless of what an industry average says.
How does a photo activation help measure experiential marketing ROI?
It instruments all four layers at once. Every session is logged with a timestamp, which makes engagement rate, dwell time, and throughput records rather than estimates. The image delivery creates a natural moment to ask for an email address and one qualifying field, which drives capture rates well above a scan station. The branded content guests share converts on-site attendance into attributable off-site reach. And the tagged, segmented list flowing into your CRM the same night is what makes revenue attribution possible at all.
How do you measure brand activation ROI when there is no direct sale at the event?
You measure the two layers that precede the sale. Cost per engaged guest and cost per captured lead are both fully measurable on site and both benchmark cleanly against other channels. Revenue attribution then follows through your CRM over a defined window, typically ninety days for a considered purchase. For activations with no revenue path at all, such as internal culture events, participation rate and a pre and post sentiment delta are the complete measurement.
What should be included in total activation investment?
Everything the activation consumed. The experience fee, staffing, creative development, custom fabrication, printing and consumables, travel, shipping, and internal team hours if your organization tracks them. Excluding soft costs inflates the return ratio and will not survive a second look from finance. An honest denominator is what makes the numerator believable.
How do you measure trade show ROI differently from a brand activation?
Trade show measurement weights Layers 3 and 4 heavily, because the audience is already qualified and the objective is pipeline. Lead quality matters more than lead volume, so add a qualifying field at capture and report on qualified opportunities rather than total badge scans. Consumer facing brand activations weight Layers 1 and 2 instead, where reach and participation are the product being bought.
Share this post
Lastest blog posts
Fresh stories, tips, and behind-the-scenes moments. See what’s new on the blog.